File this one under “How the heck did I let this one slip past me?” I’ve just discovered Elevation Profiles for Paths in Google Earth. I have no idea when this became a part of Google Earth (years ago?) but I came across this feature as I was plotting my river routes for my Backyard to Ocean post.
For any given path in Google Earth, you can select Elevation Profile and it will display a graph showing the rise and fall of that path from sea level. This works for ANY path, regardless of length or the number of anchor points. For demonstration sake, though, I like to use a path with only two anchor points – a beginning and and end.
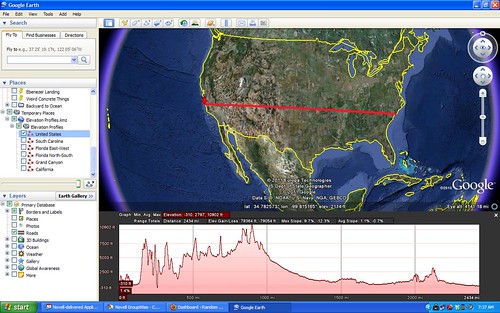
Let’s say, for example, that you create a straight line path across the continental United States. You have two anchor points – one on the west coast, and one on the east coast. Your path would look something like this…
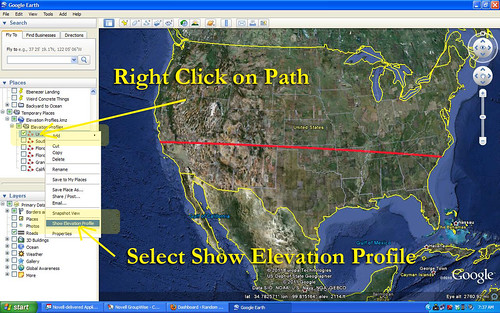
Once you have saved that path to My Places, you can right click on the path and select Show Elevation Profile from the menu. That would give you a graph like this…